
Article Summary: Core Web Vitals are the three performance metrics Google uses to measure how fast, responsive, and visually stable your website is for real users. Largest Contentful Paint measures load speed, Interaction to Next Paint measures responsiveness, and Cumulative Layout Shift measures visual stability. For small businesses these metrics directly affect search rankings, bounce rates, and conversion rates. This guide covers what each metric means, why they matter, how to measure them using Google Search Console and PageSpeed Insights, and what to fix first to stop losing rankings and customers to faster competitors.
Deep Dive with AI
What Are Core Web Vitals and How Do They Affect Your Small Business Rankings
Google's core web vitals metrics are three key performance indicators that significantly impact your search engine rankings: Largest Contentful Paint (LCP), First Input Delay (FID), and Cumulative Layout Shift (CLS). Each metric measures a unique aspect of how users interact with your page. The targets set by Google are precise:
- LCP should be under 2.5 seconds for optimal loading speed
- CLS should be under 0.1 for improved visual stability
- A fast and responsive interface for seamless interactivity
Poor core web vitals can lead to higher bounce rates and lost conversions, as faster sites consistently outperform slower ones in user engagement. As a business owner, Google Core Web Vitals serve as ranking signals alongside content quality, directly competing with larger brands for online visibility.
Why Core Web Vitals Matter for Small Business Owners
For small business owners, how well your pages perform in terms of core web vitals has a significant impact on their competitiveness in Google search results. Google's ranking systems take into account both the quality of your content and the overall user experience, which means that slow or unstable pages can actually hurt your visibility.
The specific metrics that matter most for your business include:
- Loading speed should be under 2.5 seconds (LCP) to ensure a good user experience
- User interactions should respond quickly, with an Inertia Penalty (INP) of 200 milliseconds or less
- Visual stability is crucial, with Critical Layout Shifts (CLS) measured at 0.1 or lower
When these core web vitals thresholds aren't met, the consequences can be seen in measurable ways. Industry research shows that improving website performance leads to lower bounce rates and higher conversion rates, making optimization a key factor in driving revenue.
The Connection Between Website Performance and Customer Trust
Website performance and user retention are intricately connected. Research has shown that a website's loading speed can significantly impact its ability to hold onto visitors. For instance, studies have found that websites that load in just one second tend to have conversion rates that are three times higher than those that take five seconds or more to load.
Furthermore, poor core web vitals performance can create an impression of unreliability among website visitors, leading to a loss of trust before they even get the chance to engage with your content. Additionally, metrics such as cumulative layout shift provide valuable insights into how stable and professional your site feels to users, ultimately affecting their perception of your website's overall quality.
How Poor Page Experience Drives Potential Customers Away
When core web vitals issues are left unchecked, it can lead to a frustrating user experience that ultimately causes users to leave. Research has shown that websites with poor scores tend to have significantly higher abandonment rates. Several common culprits contribute to this issue, including:
- Slow loading of the largest contentful paint
- Unexpected changes that shift unexpectedly, disrupting interactions
- High input delay times
The Competitive Advantage of a Well-Optimized Website
Small businesses that focus on improving their website's core web vitals can gain a significant advantage over their competitors who fail to prioritize performance. According to Google's field data, which reflects real user experiences, the following key factors have a direct impact on search engine rankings:
- Faster Load Times (LCP)
- Lower Clutter Loading Score (CLS scores)
- Reduced Input Delay
These elements, in conjunction with high-quality content, play a crucial role in determining a website's ranking position.
Google's Page Experience Signal and Its Role in Search Rankings
Google's Page Experience Signal is a key factor in determining how well your website ranks in search engine results. It takes into account Core Web Vitals and other experience-related factors, even if your page isn't technically perfect. This means that even with great content, a slow or unresponsive site can hurt your Google rankings.
To achieve the best results, Google looks for certain benchmarks: a largest contentful paint time of under 2.5 seconds, a cumulative layout shift score below 0.1, and an INP metric response time of under 200 milliseconds. These aren't just guidelines - they're measurable targets that can make or break your website's ranking potential.
To stay ahead, use tools like PageSpeed Insights and Google Search Console to see how real users are interacting with your site. This will help you identify pages that need improvement before they cost you visibility in search results.
How Core Web Vitals Function as a Google Ranking Factor
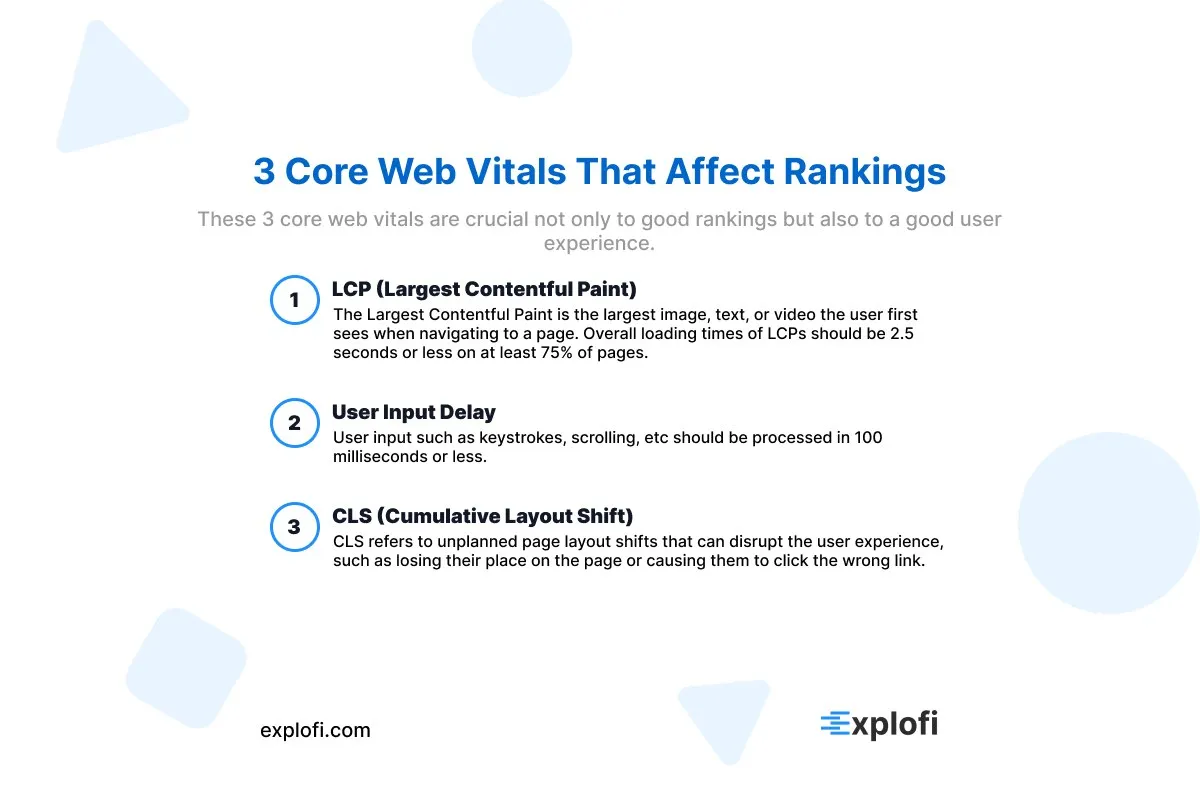
Google considers Core Web Vitals as important factors in determining page rankings within its Page Experience framework. This means that the performance of your website can impact where it appears in search engine results pages. The three metrics have specific thresholds to meet:
- LCP (Last Contentful Paint) must be completed in 2.5 seconds or less for at least 75% of pages
- Input delay, which measures how quickly a user's input is processed, should take 100 milliseconds or less
- CLS score, which indicates visual stability on the page, should remain at 0.1 or below
Research has shown that websites meeting these performance standards tend to have lower bounce rates and longer session durations. These metrics are also linked to better search engine rankings by Google, as they indicate a more positive user experience.
Why Small Businesses Are Most Vulnerable to Performance Penalties
Small businesses frequently struggle to identify issues using tools like Google Search Console or PageSpeed Insights, resulting in poor largest contentful paint scores and cumulative layout shift problems that go unchecked. Unlike large enterprise websites with dedicated development teams, small business owners who handle their own web hosting often experience slower server response times, which can push LCP beyond the 2.5-second threshold set by Google and negatively impact search rankings.
The Relationship Between Page Experience and Local SEO
Page experience plays a significant role in determining the success of local SEO, especially for businesses operating in highly competitive areas. The way a site looks and feels can greatly impact how users interact with it. A key factor in this is visual stability, which is measured by cumulative layout shift.
When a site's layout shifts minimally - ideally under 0.1 - it sends a positive signal to Google about the site's credibility. Additionally, low Latent Content Paint (LCP) scores of less than 2.5 seconds also contribute to this perception, making it more likely for nearby users to trust and engage with the site.
The Three Core Web Vitals Metrics Every Small Business Should Know
Google's three Core Web Vitals metrics are essential for small business owners to understand, as they each focus on a different aspect of user experience. The Largest Contentful Paint (LCP) metric measures how quickly your main content loads, with a score under 2.5 seconds considered good. In fact, scores under 1.5 seconds can significantly enhance the mobile version of your site.
On the other hand, Interaction to Next Paint (INP) targets responsiveness, aiming for an INP score below 200 milliseconds to prevent frustrating delays on forms and navigation. Lastly, cumulative layout shift focuses on visual stability by measuring how often your page shifts unexpectedly, with a good score being under 0.1 seconds, particularly important for ecommerce sites handling checkout flows.
Largest Contentful Paint (LCP): Why Load Speed Determines First Impressions
To achieve a fast and engaging user experience, it's essential to optimize page loading times. According to Google's Core Web Vitals guidelines, pages that load within 1.5 seconds are more likely to meet user expectations. However, if a page takes longer than 2.5 seconds to load, users tend to abandon it entirely.
To improve the First Input Delay (LCP), consider implementing the following strategies:
- Use optimized image formats to reduce file sizes and improve loading speeds.
- Set up a content delivery network (CDN) to distribute resources across multiple servers and reduce latency.
- Minimize blocking resources by optimizing code, reducing HTTP requests, and using efficient caching techniques.
What Qualifies as a Good, Needs Improvement, or Poor LCP Score
The Loading Content Performance (LCP) scores are categorized into three levels: good, needs improvement, and poor. A good score is below 2.5 seconds, while a needs improvement score falls between 2.5 and 4 seconds. A poor score exceeds 4 seconds. Both the Chrome UX report and PageSpeed Insights use real-user data from field tests to determine these thresholds, rather than relying on simulated lab results.
Common Reasons Your LCP Score May Be Suffering
When it comes to website performance, one of the biggest issues is often unoptimized images. These large files can slow down browser rendering, causing LCP scores to exceed the 4-second mark, which is considered poor. To make matters worse, render-blocking JavaScript and third-party scripts can further delay the appearance of the largest contentful paint element on screen, making it even harder for users to see what's happening.
How Slow-Loading Hero Images and Videos Hurt Small Business Sites

Hero images and videos are often among the most common elements that affect a small business site's Largest Contentful Paint (LCP) score. If left unoptimized, these assets can significantly harm LCP scores. For instance, a single uncompressed hero image can cause load times to exceed 4 seconds, which may put your site in Google's "poor" category.
To improve LCP and enhance the overall user experience, consider the following strategies:
- Convert images to WebP format to reduce file size
- Enable lazy loading selectively for noncritical elements to defer loading until needed
- Compress video files before uploading to minimize file size and improve load times
Interaction to Next Paint (INP): How Responsiveness Impacts Customer Engagement
INP measures how quickly a page responds to user interactions, with a target score below 200 milliseconds. To hit that threshold, consider:
- Reducing mainthread work
- Using lightweight scripts
- Breaking up long tasks
Slow responsiveness directly weakens customer engagement, increasing bounce rates on conversion-critical pages.
What INP Measures and Why It Replaced First Input Delay (FID)
In March 2024, INP replaced FID as the primary metric for measuring user experience because FID only accounted for the initial delay before a browser started processing an interaction, but didn't consider how long that processing actually took. INP, on the other hand, provides a more comprehensive view of user experience by tracking:
- All types of interactions, including clicks, taps, and keyboard inputs
- The entire response cycle, from rendering to the next visible update
How Poor INP Scores Lead to Abandoned Forms and Lost Inquiries
When users experience slow performance on contact or inquiry forms, their experience is negatively impacted when the INP score exceeds 500 milliseconds on initial load or submission. Studies have found that a mere 100-millisecond delay in response time can significantly decrease conversion rates by up to 7%.
Common issues include:
- Delayed button acknowledgment
- Frozen input fields
- Unresponsive dropdowns
These tiny delays make forms feel unresponsive, causing potential users to abandon the form before submitting their information.
The Role of JavaScript in Slowing Down Page Responsiveness
Heavy JavaScript execution directly increases total blocking time, preventing browsers from responding to user inputs. Execution times exceeding 50 milliseconds create noticeable delays, with scripts from:
- Third party ad networks
- Analytics tools
- Chat widgets
Cumulative Layout Shift (CLS): How Visual Instability Frustrates Visitors
CLS (Critical Load Shift) measures how much page elements unexpectedly move around during loading, and a score over 0.1 is considered subpar for maintaining visual stability. This movement often occurs when:
- Images load without clear dimensions
- Ads or embeds insert content above existing text
- Web fonts change mid rendering
A CLS score of 0.25 or higher is deemed poor by Google, which can lead to visitors accidentally clicking on the wrong elements, resulting in increased bounce rates and decreased conversion rates on critical pages.
What Causes Unexpected Layout Shifts on Small Business Websites
When unexpected layout shifts occur on a website, it is often due to a few common issues. These include:
- Loading images or ads without reserving their dimensions
- Web fonts being swapped late, which can push text downward
- Dynamically injected content pushing existing elements around
By reserving space for media in your CSS, you can prevent these layout shifts and improve your site's cumulative layout shift score. This, in turn, enhances the overall visual stability.
How CLS Issues Lead to Accidental Clicks and Poor User Experience
When a CLS score reaches 0.25 or above, page elements start to behave erratically, making it difficult for users to accurately tap on buttons or links. This issue is particularly problematic on business websites that have mobile versions, as the smaller touch targets can lead to mistakes. A misplaced ad or delayed banner can also cause customers to be redirected away from a checkout page, resulting in lost conversions.
Furthermore, poor visual stability makes even routine browsing a frustrating and error-prone experience.
The Impact of Third-Party Ads and Embeds on CLS Scores
Third-party ads and embeds are often a major contributor to cumulative layout shift, as they inject dynamic content that disrupts the existing layout of a webpage. Some common culprits include:
- Ad networks
- Social media embeds
- Chat widgets
These types of elements can significantly increase the CLS score, pushing it past Google's recommended threshold of 0.25.
The Transition From First Input Delay (FID) to Interaction to Next Paint (INP)
Google recently replaced its Feedback Inventory Diagram (FID) metric with the Input Performance Index (INP), significantly boosting the benchmark for interactivity in March 2024. Unlike FID, which only measured the input delay of a single interaction, INP tracks every interaction throughout a webpage's entire lifecycle.
To achieve a good score, responses must be delivered within 200 milliseconds or less.
Why Google Made the Switch and What It Means for Your Site
The FID metric only measures the time it takes for a browser to respond to a single user interaction, which doesn't account for repeated interactions. On the other hand, INP tracks every interaction throughout an entire session, providing Google with a more complete picture of how users actually experience a website.
Since core web vitals impact search rankings by using data from real users, this broader measurement makes INP a stronger indicator of ranking high-traffic and conversion-focused pages.
Key Differences Between FID and INP Measurements
Unlike the FID method, which only detects a single input delay, INP measures every interaction that occurs during a session, including:
- Clicks
- Taps
- Keyboard inputs
INP scores above 200 milliseconds are considered to be "needs improvement," whereas FID only flagged delays exceeding 100 milliseconds.
How Core Web Vitals Directly Influence Small Business Revenue
Poor Core Web Vitals scores can have a significant impact on small businesses, causing a direct financial loss that many owners often overlook. Research has consistently shown that websites with a largest contentful paint time of 2.5 seconds or less tend to see substantially higher conversion rates, as users are much less likely to abandon their purchases or inquiries.
When a site takes too long to load or layout elements shift unexpectedly, bounce rates skyrocket, resulting in lost lead generation opportunities before visitors even get a chance to read your offer. According to Google's own data, a one-second delay in mobile loading times can reduce conversions by as much as 20%.
Furthermore, poor scores also negatively affect organic rankings by weakening the page experience signal, which ultimately leads to reduced revenue due to lower volumes of qualified traffic reaching your pages.
The Link Between Faster Load Times and Higher Conversion Rates
A one-second delay in page loading time can significantly impact conversion rates, with studies from Akamai showing that it reduces conversions by as much as 7% per second of delay. When a website loads within a faster timeframe - specifically under 2.5 seconds - it meets the largest contentful paint threshold, which is a key metric for site performance.
As a result, bounce rates tend to decrease sharply, ultimately increasing revenue opportunities for small businesses and helping them capitalize on this improved user experience.
How Improved Responsiveness Reduces Bounce Rates for Small Businesses
When it comes to website performance, having a Fast Idle Duration (FID) under 100 milliseconds can make a significant difference in reducing bounce rates. Users who experience near-instant responsiveness are more likely to stay on the site. Here's how FID is categorized:
- An FID of less than 100ms falls into the "good" range, indicating fast and responsive performance.
- A delay between 100300 milliseconds requires improvement, as it may cause users to feel a slight lag.
- An FID that exceeds 300 milliseconds is considered poor, which can lead to increased abandonment rates.
A slow input delay can also signal an unresponsive page, causing visitors to lose interest before making a conversion.
Real-World Examples of Businesses Seeing Revenue Gains From Optimization
Improving largest contentful paint to under 2.5 seconds has shown significant revenue benefits for small businesses, including:
- Increased engagement rates
- Longer session durations
- Improved micro conversion rates
Google Search Console's core web vitals report enables businesses to focus on fixing high-priority pages that impact conversions the most.
Understanding the Difference Between Lab Data and Field Data
Lab data is obtained from controlled test environments such as PageSpeed Insights, while field data represents the actual user interactions gathered through the Chrome User Experience Report (CrUX). To access CrUX data, you can utilize:
- Google Search Console
- The field section of PageSpeed Insights
- The CrUX API
Field data captures real-world factors like device type and network speed, making it more accurate for determining how core web vitals impact your actual visitors.
Why Lab Data and Real-World Performance Can Tell Different Stories
When analyzing lab data from tools like PageSpeed Insights, tests are run under controlled conditions, which means they simulate a single device and network setup. On the other hand, real-world field data, captured through CrUX, provides insights into thousands of actual visits across different devices and varying connection speeds.
Even if a page scores well on LCP in testing, it may not perform as expected in the real world when mobile users with slower networks try to load it.
Which Data Type Google Uses to Evaluate Your Rankings
Google's algorithm is heavily influenced by data collected from the Chrome User Experience Report (CrUX), which provides a more accurate picture of search engine rankings than lab simulations. This real-world data reflects how users interact with websites on various devices and networks. By analyzing this field data, Google Search Console helps website owners identify areas for improvement, including issues related to largest contentful paint, visual stability, and input delay, all of which must meet established standards.
How to Measure Core Web Vitals for Your Small Business Website
To ensure a reliable website experience for your small business, Google PageSpeed Insights and Google Search Console are the top two tools for running a thorough core web vitals test. PageSpeed Insights provides lab data under controlled conditions, mimicking specific devices and networks, whereas Search Console reveals real-world data gathered from thousands of actual user visits.
This distinction is crucial because a page may display a good LCP score in laboratory testing but still struggle to load quickly when mobile users on slower connections access it. For high-traffic or high-conversion value pages, Search Console's Core Web Vitals report highlights exactly which URLs require attention, making it easier to prioritize core web vitals optimization where it matters most.
Using Google PageSpeed Insights to Get an Instant Performance Snapshot
PageSpeed Insights provides a score out of 100, analyzing page performance by dividing it into four main categories. By entering a URL into the tool, you can quickly see your LCP and cumulative layout shift scores, along with helpful suggestions for improvement. It's essential to note that scores below 50 indicate subpar performance, while scores above 90 signify optimized loading.
This gives small businesses a clear goal to strive for, allowing them to track their progress effectively.
How to Find Core Web Vitals Data Inside Google Search Console
To get started with improving your website's performance in Google Search Console, navigate to the "Experience" section and select "Core Web Vitals." This will give you access to a detailed report that categorizes each page into three levels of performance:
- Poor (red), indicating areas where users may experience issues
- Needs Improvement (yellow), suggesting opportunities for improvement
- Good (green), showing pages that meet the recommended standards
By analyzing this data, which is based on real-world user behavior and device interactions, you can identify specific URLs that require attention to enhance your website's overall performance.
Leveraging the Chrome User Experience Report (CrUX) for Real User Data
CrUX aggregates real user data from Chrome browsers to measure key metrics such as largest contentful paint and cumulative layout shift during actual visits. Unlike lab simulations, this field data provides a more accurate representation of:
- Varying network speeds
- Different device types
- Real interaction patterns
Google's ranking algorithm relies heavily on this data, making CrUX one of the most reliable indicators of how core web vitals impact your site's search visibility.
Using Third-Party Tools Like Semrush Site Audit for Deeper Analysis
Semrush Site Audit scans for issues that are directly related to three key factors: largest contentful paint, cumulative layout shift, and input delay. It identifies specific URLs rather than entire domains, providing a detailed report of potential problems. The scan categorizes its findings into three main categories:
- Errors
- Warnings
- Notices
This precise breakdown allows you to focus on the most critical issues, such as render-blocking resources or unoptimized images that are slowing down individual pages. By targeting these specific problems, you can make more effective and targeted fixes rather than trying to address broad reports of potential issues.
How the Web Vitals Chrome Extension Helps Diagnose Issues in Real Time
The Web Vitals Chrome Extension offers real-time metric readings as you explore your own website, highlighting key performance indicators like largest contentful paint, cumulative layout shift, and input delay in an instant. Unlike PageSpeed Insights, this tool captures metrics in actual browsing conditions, using a color-coding system to provide clear results: green (exceeding Google's standards), yellow (requiring improvement), or red (falling short) based on established thresholds: largest contentful paint under 2.5 seconds, cumulative layout shift under 0.1, and input delay under 100 milliseconds.
Frequently Asked Questions
What Are Core Web Vitals and Why Do They Matter for Small Businesses?
Core Web Vitals are a set of metrics used by Google to measure user experience, focusing on three key areas: load speed, responsiveness, and visual stability. The most important indicators are Largest Contentful Paint, which should take less than 2.5 seconds, First Input Delay, with a response time of under 100 milliseconds, and Cumulative Layout Shift, which should be minimal at around 0.1. For small businesses, achieving these standards has a significant impact on search rankings, bounce rates, and conversion rates, making them crucial performance benchmarks.
How Do Core Web Vitals Directly Impact My Website's Search Engine Rankings?
Google's page experience signals play a significant role in determining search engine rankings through Core Web Vitals. Meeting specific thresholds is crucial for delivering a high-quality user experience. The Largest Contentful Paint must be under 2.5 seconds, while Interaction to Next Paint should take less than 200 milliseconds. Additionally, Cumulative Layout Shifts should be minimal, at or below 0.1 seconds. Achieving these scores can lead to lower bounce rates, increased engagement, and improved rankings on commercially important websites.
What Are the Three Main Core Web Vitals Metrics I Need to Track?
The three key performance indicators for a website are Largest Contentful Paint (LCP), Interaction to Next Paint (INP), and Cumulative Layout Shift (CLS). According to Google's guidelines, achieving good scores is crucial, with LCP loading times under 2.5 seconds, INP response times under 200 milliseconds, and CLS visual shifts under 0.1. These metrics evaluate a website's loading speed, interactivity, and visual stability, all of which impact your page experience rankings.
How Can I Check My Small Business Website's Core Web Vitals Scores?
To ensure your small business website is performing well, you can check its Core Web Vitals scores using Google PageSpeed Insights or Google Search Console. These tools help identify pages with low ratings across key metrics, including Largest Contentful Paint, which should load in under 2.5 seconds, Cumulative Layout Shift, which should remain below 0.1, and Interaction to Next Paint, which should take less than 200 milliseconds.
What Is a Good Core Web Vitals Score for a Small Business Website?
A good score on Google meets certain criteria: a Load Content Period (LCP) of less than 2.5 seconds, a Critical Layout Shift (CLS) below 0.1, and a First Input Delay (FID) of under 100 milliseconds. These benchmarks align with real user experience expectations and directly impact search engine rankings. Meeting these targets can enhance engagement and conversion rates, making them realistic goals for any small business website seeking to boost its SEO performance.
How Long Does It Take to See Ranking Improvements After Optimizing Core Web Vitals?
After optimizing Core Web Vitals, website owners often experience a delay of 28 days or more in seeing significant ranking improvements. This is because Google needs time to recrawl and reindex the pages. To monitor progress, it's crucial to check Google Search Console and PageSpeed Insights regularly. However, other factors like site authority and competition can impact the timeline, making consistent optimization and avoiding setbacks essential for sustained long-term gains.